100 Days of Gatsby - Display a List of Orders From a CSV File
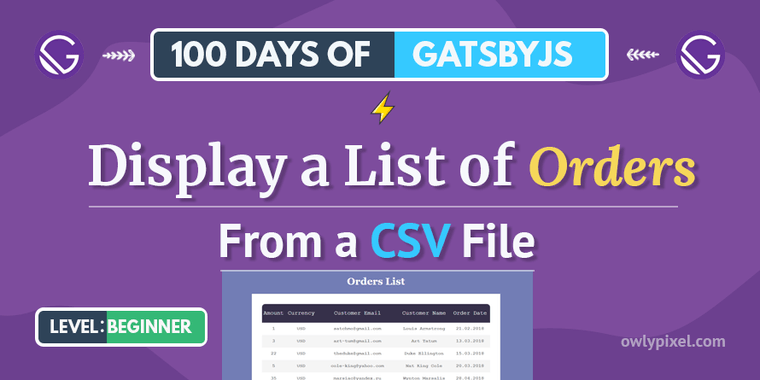
Did you hear the news? There's a new challenge on the block called '100 Days of Gatsby', a fun way to explore this awesome platform by building various projects every week. Yay! count me in!
Participating in challenges like CodePen Challenge, 100 Days Of Code, is a great way to pump up your development skills.
Starting on January 1st, the Gatsby team joined the party with their 100 Days of Gatsby challenge and this is awesome news!
The first challenge is to build a blog where you can track your coding progress and document your ups and downs.
Since I already have a blog, the one you’re reading right now, I decided to improvise and start with something very simple but useful.
About a year ago I wrote a blog post where I showed how to scaffold an app from an existing database with ASP.Net Core. So, I thought why not reuse the same database in the form of a .csv file and display its contents using Gatsby? This is a pretty straightforward but practical task since .csv is a very popular data format.
So, if you’re new to Gatsby, put that Netflix show you’ve been watching on pause, grab a glass of water, and let’s build this fun little project together!
Creating a basic Gatsby site
Ok, for starters we’ll need to put together a very basic Gatsby site. Create a project folder called Orders somewhere on your hard drive.
To make the simplest Gatsby site we’ll need to install gatsby and a couple of libraries. Change into this folder and run the following commands:
npm init -ynpm install gatsby react react-domAfter that, create an src/pages/index.js file. This will be the main index component for our project.
In this file add the following:
import React from 'react';
export default () => <p>Should we write some code?</p>
If we now start our site in development by executing gatsby develop in the terminal, we’ll see this piece of art:

The audience applauds, bravo! But wait, how would one add data to a Gatsby site?
Installing a source plugin
Well, there are a bazillion ways how you can get data into a Gatsby site. In this particular case, we’re going to use the gatsby-source-filesystem plugin. Let’s install it in our terminal:
npm install gatsby-source-filesystemThis will give us the ability to actually access the data from the file system, but we need to tell Gatsby that we now have this wonderful plugin installed.
We can do this by creating a gatsby-config.js file in the root of our project, right next to the package.json file:
module.exports = { plugins: [ { resolve: 'gatsby-source-filesystem', options: { name: 'orders', path: 'data' } } ]}It’s a JavaScript file that exports a configuration object for our site. In this object, we have a plugins property, which is an array of installed plugins. That’s where we’re adding our newly installed gatsby-source-filesystem plugin.
Note: If the plugin has configuration options, we’re specifying it as an object and not just a simple string.
Here we’re telling Gatsby to check the data folder for data that we’ll be using.
Once you’ve done this, you can start the development server again:
gatsby developNow Gatsby will look into this folder and say ”Hey we’ve got some files here, sweeet!“.
That’s all great. Now open up GraphiQL explorer in your browser: http://localhost:8000/___graphql.
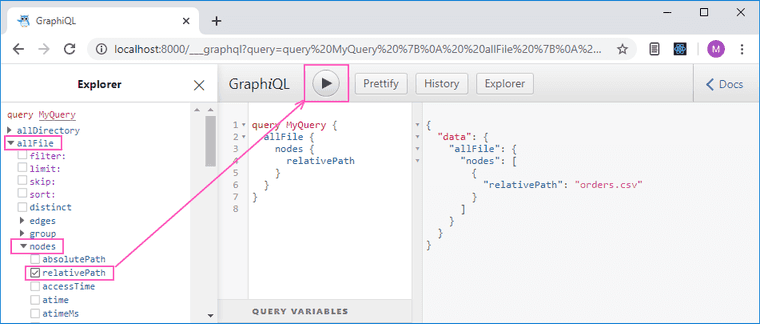
Here we can check out what Gatsby knows about our files. In the explorer select allFile\nodes\relativePath node, and hit Play. You’ll see that we now have access to our orders.csv file.
Awesome. But what can we do with it? How do we get the contents of our file? For that, we’ll use something called a transformer plugin.
Adding a transformer plugin
With the help of transformer plugins, we can transform the raw content from the source plugins into something that we can use. We’ve got our file nodes and with the help of the gatsby-transformer-csv plugin, we can turn them into csv nodes.
The same goes for other types of files. We can use all sorts of transformer plugins to transform our file nodes into image nodes, json nodes, markdown nodes, etc..
Stop the server and install this plugin by typing the following in your terminal:
npm install gatsby-transformer-csvNow we can add it to the config file.
module.exports = { plugins: [ { resolve: 'gatsby-source-filesystem', options: { name: 'orders', path: 'data' } }, `gatsby-transformer-csv` ]}Since we’re not passing any additional options for this plugin, we can simply specify its name. Start the server again:
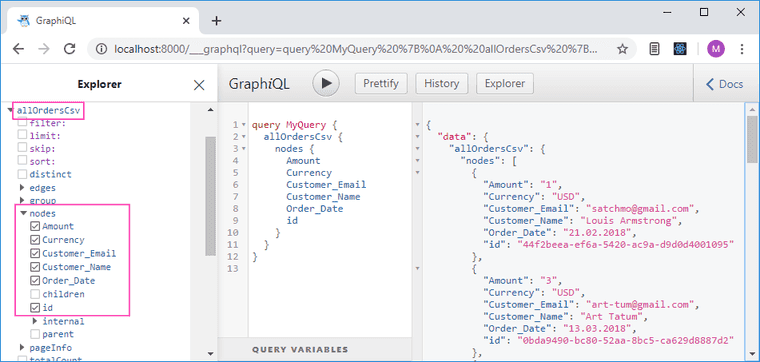
gatsby developAnd now, in our GraphiQL explorer, we have another node - allOrdersCsv, where we can actually see the contents of our file.
Displaying data on a page
Now we need to take this data that we have and put this on the page somehow. Let’s put together a really simple layout to show the list of our orders.
Create the layout file in the components folder: src/components/layout.js with the following contents:
import React from 'react';
const Layout = ({ children }) => {  <>    <header>      <h1>Orders List</h1>    </header>    <main>{children}</main>  </>}
export default Layout;
This is a very simple component that takes a children prop and displays the basic structure of a page. Now we can use it in our index.js file:
import React from 'react';import Layout from '../components/layout';
export default () => {  <Layout>    <p>Should we write some code?</p>  </Layout>}
Another thing that we’re going to do is add a bit of styling. In our components folder create a layout.css file:
*,*:before,*:after {  box-sizing: border-box;}body,html {  height: 100%;  margin: 0;  background-color: #727db5;  font-family: Georgia, 'Times New Roman', Times, serif;}
main {  max-width: 800px;  margin: 0 auto;  border: 1px solid #dedede;  background-color: #fff;  height: 100vh;  padding: 2rem;}h1 {  text-align: center;  color: #fff;}
Once you’ve done that, import it in layout.js like so:
import React from 'react';import './layout.css';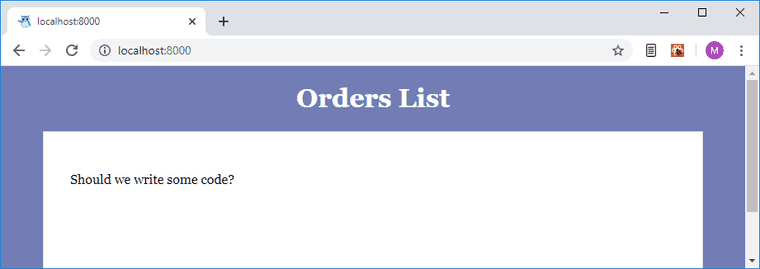
Alright, now our basic layout is ready and we can move on to actually displaying the data from our file. In our index.js page, add the following:
import React from "react";import Layout from "../components/layout";import { graphql } from "gatsby";
export const query = graphql`  query {    allOrdersCsv {      nodes {        Amount        Currency        Customer_Email        Customer_Name        Order_Date        id      }    }  }`;
export default ({ data }) => {  const orderNodes = data.allOrdersCsv.nodes;
  return (    <Layout>      <table>        <thead>          <tr>            <th>Amount</th>            <th>Currency</th>            <th>Customer Email</th>            <th>Customer Name</th>            <th>Order Date</th>          </tr>        </thead>        <tbody>          {orderNodes.map(node => (            <tr key={node.id}>              <th>{node.Amount}</th>              <th>{node.Currency}</th>              <th>{node.Customer_Email}</th>              <th>{node.Customer_Name}</th>              <th>{node.Order_Date}</th>            </tr>          ))}        </tbody>      </table>    </Layout>  );};
We’re importing graphql at the top to be able to query data in our page. Next, we’re exporting a query, using graphql as a tag template literal and putting inside our query from GraphiQL playground.
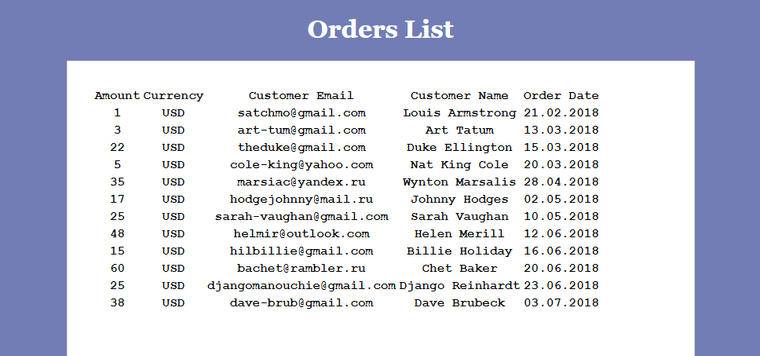
During the build, Gatsby is going to pick up this query, run it, and pass the results of it to our component as data prop. Then, in the component we’re getting the orderNotes array out of the data and building a simple table using this data.
Here’s what we have this far:
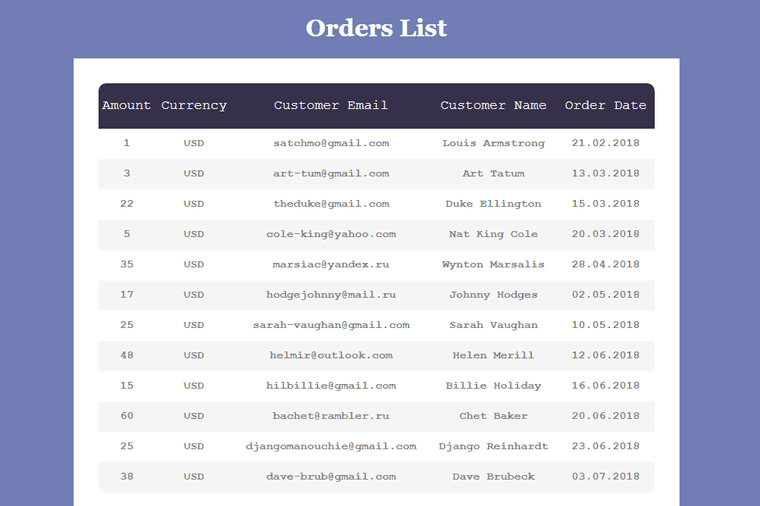
You’ve probably noticed that our list looks pretty simple, how about adding some styles? Let’s add some basic table styles to our layout.css file:
table { border-collapse: collapse; background: white; border-radius: 10px; overflow: hidden; width: 100%; margin: 0 auto;}thead tr { height: 60px; background: #36304a;}thead tr th { font-size: 18px; color: #fff; line-height: 1.2; font-weight: unset;}tbody { font-family: "Courier New", Courier, monospace;}tbody tr { font-size: 15px; color: #808080; line-height: 1.2; font-weight: unset;}table tbody tr { height: 40px;}tbody tr:nth-child(even) { background-color: #f5f5f5;}
Great! That looks better.
Final words
I hope that this post was somewhat useful for people who are learning Gatsby.
Now you can see for yourself how simple it is to get data into a Gatsby’s GraphQL data layer, transform it into any form that you need and display it on a page.
Please, share your work on Twitter, I’m really excited to see what other people are building with this awesome tool.
Cheers!


